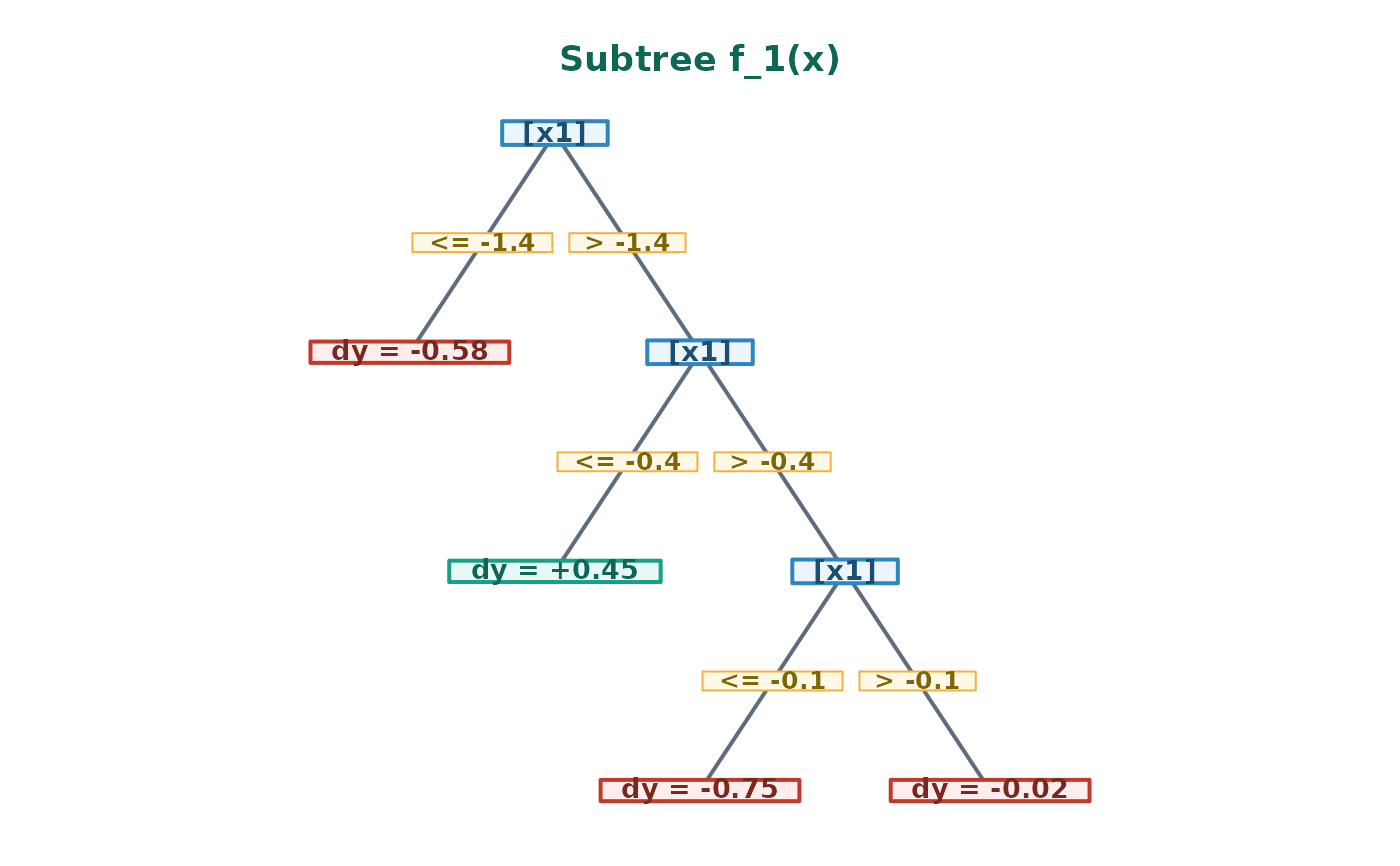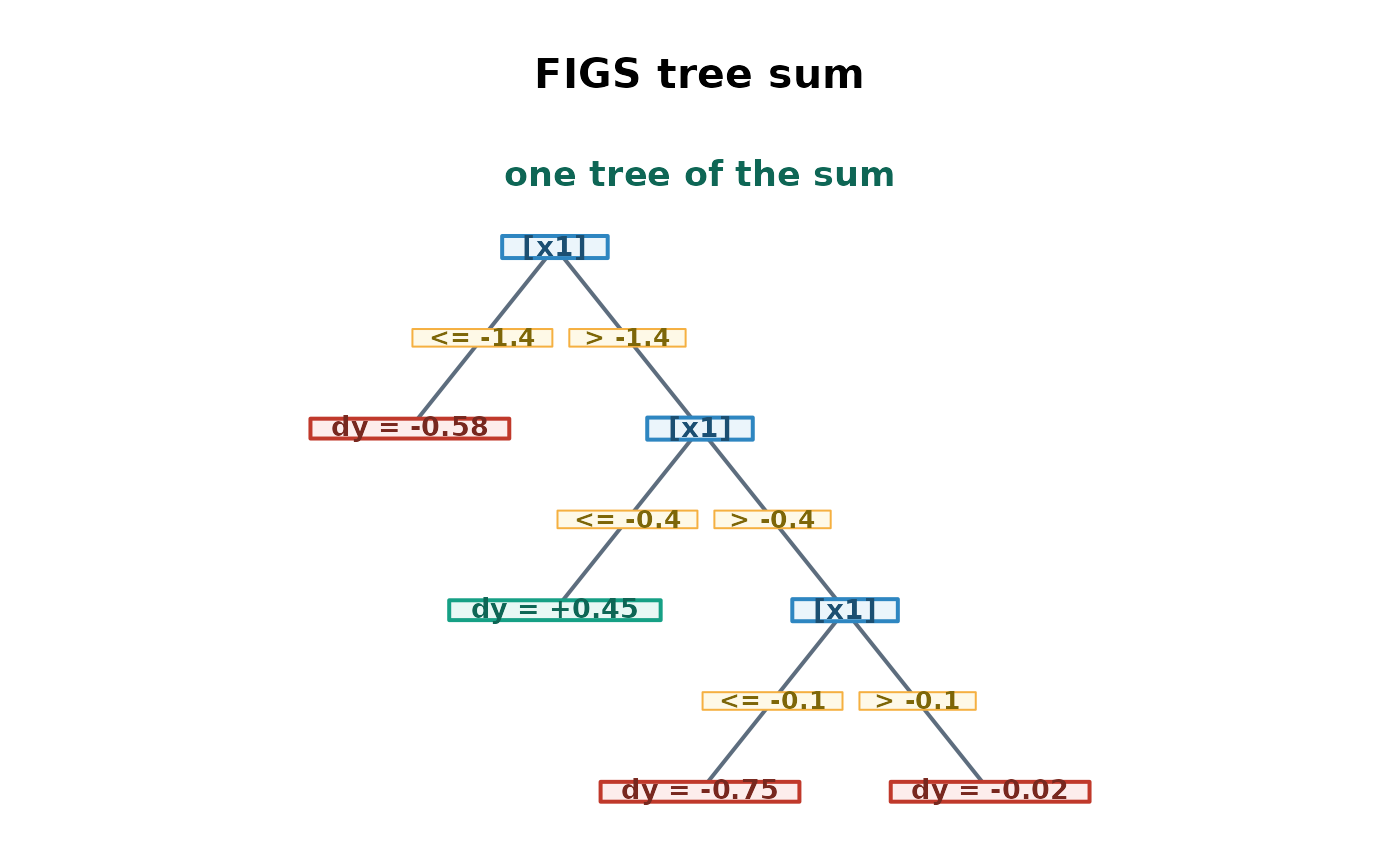
plot.figsr_fit() visualizes individual decision trees comprising the
Fast Interpretable Greedy-Tree Sums (FIGS) model using 100% Base R graphics
(zero external package dependencies).
Nodes are spaced from the width of their own labels, so boxes and branch conditions never overlap, and each tree gets a panel width proportional to the room it needs. When a tree does not fit its panel, the whole drawing is scaled down – text included – rather than clipped; enlarge the device to get larger text.
Arguments
- x
A fitted
figsr_fitmodel object.- tree_idx
Optional integer vector specifying indices of trees to plot. Default is
NULL(plots all trees).- style
Character string specifying the visual style:
"scientific"(default, scientific/editorial notation),"modern"(rounded pastel boxes), or"classic"(high-contrast minimalist statistical style).- main
Optional character string. An overall title drawn once above every tree panel. Default is
NULL(no overall title, the previous behavior).- tree_names
Optional character vector overriding the per-tree panel titles (
"Subtree f_1(x)","Tree 1", ...). Either a single string, applied to every plotted tree, or a vector with one entry per tree inx$trees– indexed by each tree's position in the fit, not by plotting order, so it stays correct whentree_idxonly plots some of them.NAin a given position falls back to the default title for that tree only. Default isNULL(the previous, automatic titles).- ...
Additional arguments, currently ignored.